In the world of software development, logging is an indispensable tool for monitoring applications, troubleshooting issues, and improving performance. However, managing logs can be a daunting task due to the volume of data generated and the need for efficient analysis tools.
DEV - DOTNET - TELEMETRY - GRAFANA - LOKI - LOGS
Introduction
In the world of software development, logging is an indispensable tool for monitoring applications, troubleshooting issues, and improving performance. However, managing logs can be a daunting task due to the volume of data generated and the need for efficient analysis tools.
Enter Loki and Grafana, a powerful combination for managing and visualizing logs. Loki, developed by Grafana Labs, is a log aggregation system inspired by Prometheus. Paired with Grafana, an open-source platform for monitoring and observability, Loki enables developers to visualize log data through dashboards, making it easier to understand patterns, track down errors, and gain insights into their applications. This blog post aims to guide you through the process of setting up the infrastructure and integrating logging in your C# applications using Loki, followed by visualizing and analyzing those logs with Grafana.
Infrastructure
Setup
Grafana and Loki are required for this tutorial, the most common option for setting up infrastructure is containers.
Setup Grafana & Loki using Podman Desktop
# Cleanup
podman rm gdev-grafana -f
podman rm gdev-loki -f

# Create network
podman network create gdev-net

# Run grafana & Podman
podman run --network gdev-net --name gdev-grafana -d -p 3000:3000 grafana/grafana
podman run --network gdev-net --name gdev-loki -d -p 3100:3100 grafana/loki

#Note: Grafana default credentials are admin/adminsetup-with-podman.ps1 and run it on PowerShellSetup Validation
- Grafana:
curl -i http://localhost:3000/api/healthuntil response code is 200 - Loki:
curl -i http://localhost:3100/readyuntil response code is 200
Configuration
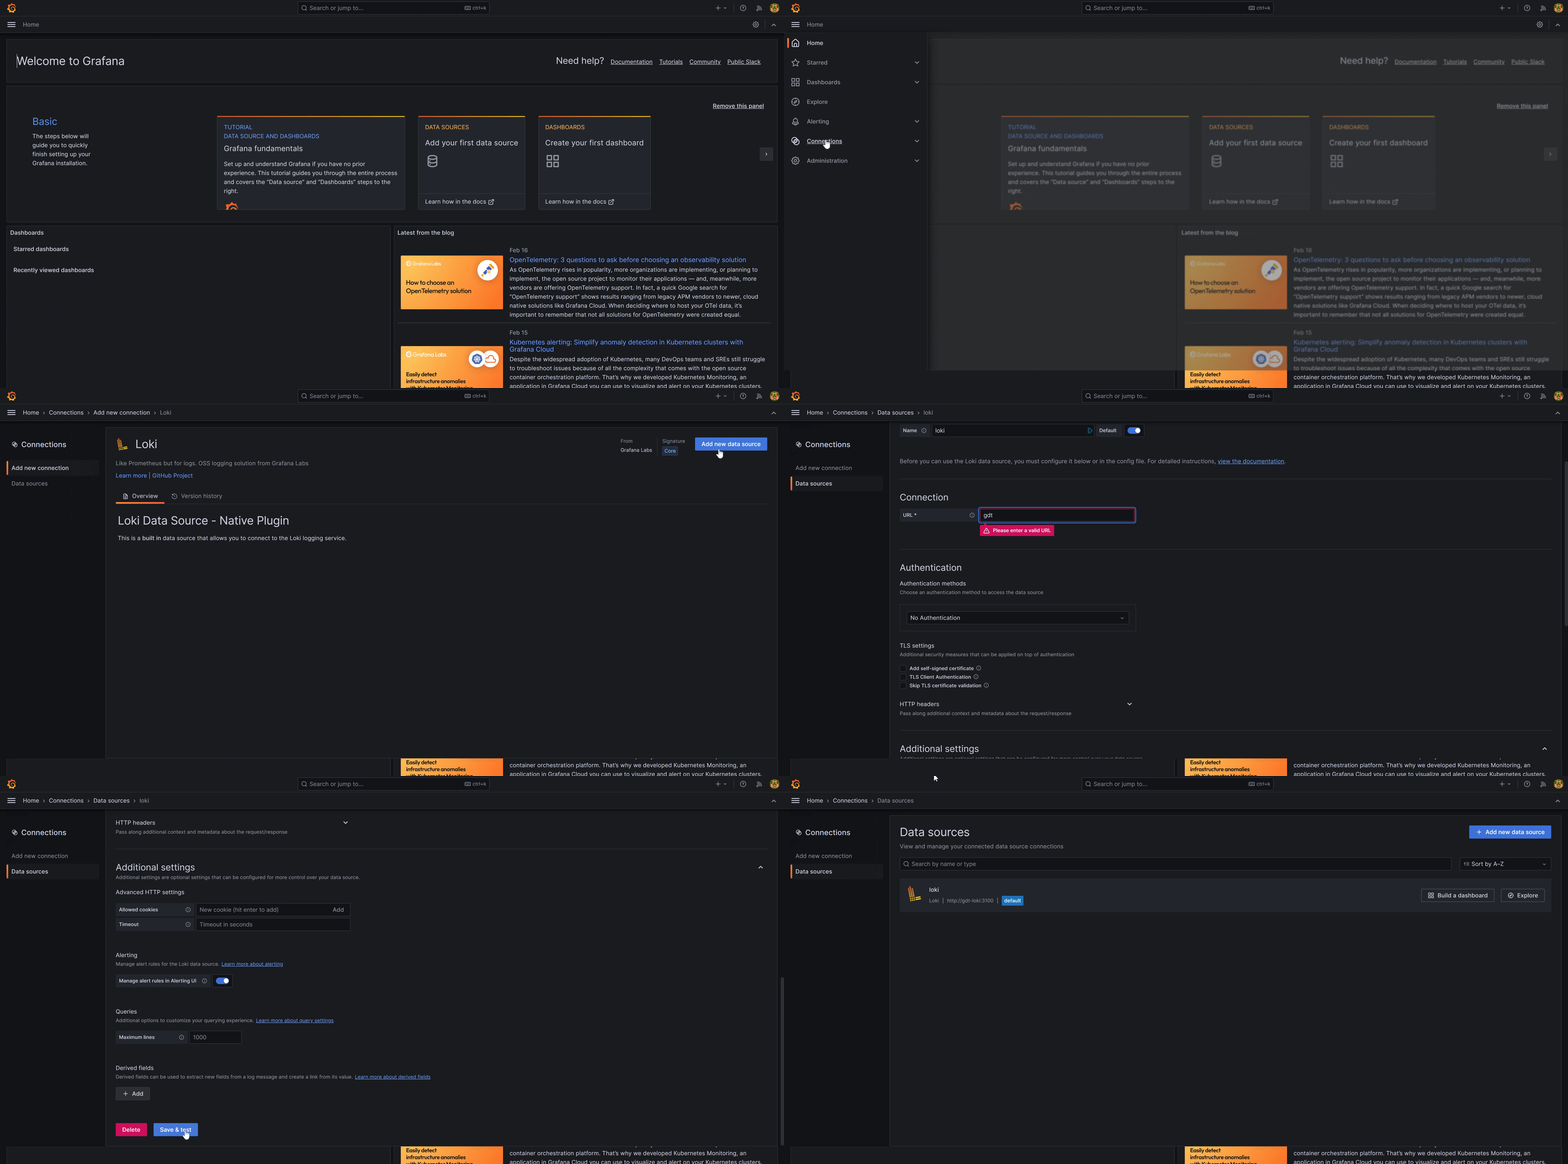
The next step is to connect Grafana with Loki:
1. Login to Grafana (default credentials are admin/admin)
2. Open the main menu from the 3-bars icon on top left
3. Navigate to "Connections"
4. Enter "Loki" on the search bar and Select the "Loki" options from the results
5. Click on the "Add new data source" button on top right
6. Type http://gdev-loki:3100 on the "URL" field
7. Click the "Save & Test" button on the bottom of the page
Application
Create a new dotnet application:
dotnet new console --name GDEV.Logging.ConsoleAppInstall the following nuget packages (run the command inside the application folder)
dotnet add package Serilog
dotnet add package Serilog.Settings.Configuration
dotnet add package Serilog.Sinks.Console
dotnet add package Serilog.Sinks.Grafana.Loki
Replace the following code in program.cs :
using System;
using System.Runtime.CompilerServices;
using Serilog;
using Serilog.Context;
using Serilog.Sinks.Grafana.Loki;

class Program
{
    const string facility = "gdev-tracing-consoleapp";

    static async Task Main(string[] args)
    {
        // Create a "facility" label to group all our logs under
        var facilityLabel = new LokiLabel() {
            Key = "facility",
            Value = facility };

        // Setup Logger with Console & Loki sinks (outputs)
        Log.Logger = new LoggerConfiguration()
            .Enrich.FromLogContext()
            .WriteTo.Console()
            .WriteTo.GrafanaLoki(
                "http://localhost:3100",
                new List<LokiLabel>() { facilityLabel })
            .CreateLogger();

        // Add the "action" property to all logs inside the using scope
        using (LogContext.PushProperty("action", "gdev-custom-action"))
        {
            Log.Logger.Information("Starting custom action");
            await Task.Delay(TimeSpan.FromMilliseconds(200));
            Log.Logger.Information("Custom action completed");
        }

        // Flush the logs to ensure being send to loki
        Log.CloseAndFlush();
    }
}program.csRun the application
dotnet runLog Visualization / Inspection
In order to view the logs we need to open Grafana and configure the visualization.

