Monitoring .NET Web API Metrics with Prometheus and Grafana on Windows
In this post we learn how to instrument a .NET Web API with OpenTelemetry Metrics, how to collect them using Prometheus, and how to visualize them in Grafana.
References: Code Repository | YouTube video
Introduction
Solution Layout
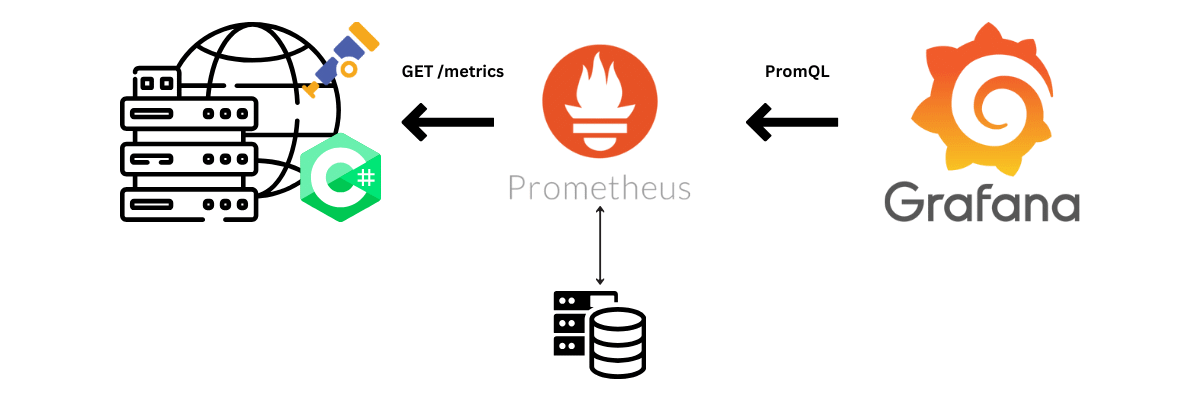
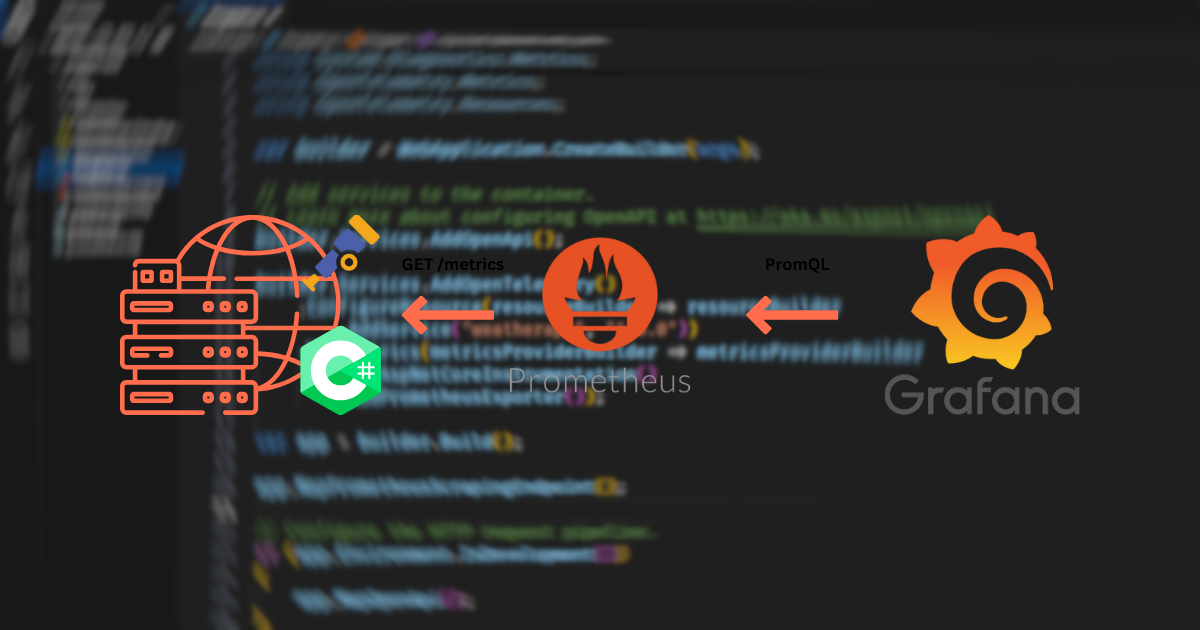
The solution we will build has three major components:
- A C# application instrumented with OpenTelemetry Metrics.
- Prometheus, which scrapes (collects) and stores the metrics exposed by the application.
- Grafana, which retrieves, transforms, and visualizes the metrics stored in Prometheus.
Before we start implementing the solution, we should understand what a metric is and how it works.
What Are Metrics?
In the context of observability, a metric is a named, labeled, timestamped, numerical measurement that captures some property of system behavior. Let’s break that down:
- Named: All measurements of the same logical thing share the same metric name. For example,
http_server_request_countrepresents the number of HTTP requests the server handled. - Labeled: We differentiate series with the same name using label key/value pairs (dimensions). For example,
http_server_request_countmight includehttp_routeandresponse_codelabels so we can slice by endpoint and status. - Timestamped: Each measurement corresponds to a point in time (explicitly or implicitly when scraped).
The Prometheus exposition format (text-based and most common) expresses each sample as:
metric_name{label1="value1",label2="value2"} value [optional_timestamp]
If the timestamp is missing, Prometheus uses the scrape time.
Example output:
http_server_request_count{http_route="/weatherforecast",response_code="200"} 15
http_server_request_count{http_route="/health/ready",response_code="200"} 200
This tells us /weatherforecast has been called 15 times and /health/ready 200 times since the process started.
Our application only exposes the current cumulative totals. Prometheus stores the time series history across scrapes. From that history we can derive rates by diffing successive samples. Because we record cumulative counts, values should monotonically increase—except when the process restarts (the counter resets).
Measuring Durations
Measuring durations is trickier than counting invocations. A naive approach would record only the total cumulative duration and divide by total calls to get an average. That hides latency spikes and distribution shape: we can’t tell whether all calls are uniformly slow or a few outliers skew the mean.
OpenTelemetry (and Prometheus histograms) address this by tracking counts of observations falling into pre-defined latency buckets. With bucketed counts plus the total count and sum, we can approximate latency distributions and compute quantiles (e.g., 50th / 95th percentile) with reasonable accuracy.
Implementation
DotNet WebAPI application
Now that we have some background, let’s build the solution. We’ll start by creating a new .NET Web API project:
\> dotnet new webapi --name weatherappNow let’s add the required package references:
\> cd weatherapp
\> dotnet add package OpenTelemetry.Extensions.Hosting
\> dotnet add package OpenTelemetry.Instrumentation.AspNetCore
\> dotnet add package OpenTelemetry.Exporter.Prometheus.AspNetCore --prerelease
Next we add code to Program.cs. We need three blocks:
- The
usingstatements at the top. - The
builder.Services.AddOpenTelemetry()configuration for metrics (resource, meters, instrumentation, exporter). - The
app.MapPrometheusScrapingEndpoint();to expose the/metricsendpoint.
+using System.Diagnostics.Metrics;
+using OpenTelemetry.Metrics;
+using OpenTelemetry.Resources;

var builder = WebApplication.CreateBuilder(args);

// Add services to the container.
// Learn more about configuring OpenAPI at https://aka.ms/aspnet/openapi
builder.Services.AddOpenApi();

+builder.Services.AddOpenTelemetry()
+    .ConfigureResource(resourceBuilder => resourceBuilder
+        .AddService("weatherapp", "1.0.0"))
+    .WithMetrics(metricsProviderBuilder => metricsProviderBuilder
+        .AddMeter("weatherapp").AddAspNetCoreInstrumentation()
+        .AddPrometheusExporter());

var app = builder.Build();

// Configure the HTTP request pipeline.
if (app.Environment.IsDevelopment())
{
    app.MapOpenApi();
}

app.UseHttpsRedirection();

+ app.MapPrometheusScrapingEndpoint();


var summaries = new[]
...
As a good practice, let’s also edit appsettings.json to pin the server’s port:
{
  "Logging": {
    "LogLevel": {
      "Default": "Information",
      "Microsoft.AspNetCore": "Warning"
    }
  },
  "AllowedHosts": "*",
+  "urls":"http://localhost:7070"
}
Our application is now ready. It exposes metrics at http://localhost:7070/metrics; we can confirm this by opening the endpoint in a browser.
Prometheus: Setup & Run
Prometheus scrapes (reads) the /metrics endpoint and stores the time series. We set it up as follows:
- Download the latest binary (version 3.5 at the time of writing) from the Prometheus Releases page.
- Extract the contents to a folder.
- Edit
prometheus.ymland append our scrape job (watch the indentation):
...
scrape_configs:
  # The job name is added as a label `job=<job_name>` t...
  - job_name: "prometheus"

    # metrics_path defaults to '/metrics'
    # scheme defaults to 'http'.

    static_configs:
      - targets: ["localhost:9090"]
       # The label name is added as a label `label_name=<label_value>` to ...
        labels:
          app: "prometheus"

+  - job_name: "weatherapp"
+    static_configs:
+      - targets: ["localhost:7070"]
+        labels:
+          app: "weatherapp"
- Run Prometheus (
prometheus.exe) and visit http://localhost:9090/targets to verify it’s running and scraping our app.
Grafana: Setup & Run
Grafana lets us explore and visualize the collected metrics:
- Download the latest OSS standalone binaries (version 12.11 at the time of writing) from the Grafana downloads.
- Extract the contents to a folder.
- (Optional) Remove authentication: create
conf/custom.iniand add:
[security]
allow_embedding = true
cookie_samesite = none
cookie_secure = false

[auth.anonymous]
enabled = true
org_role = Admin- Run Grafana (
bin/grafana-server.exe) and visit http://localhost:3000 to verify it’s running.
Grafana: Add Prometheus Data Source
Before we can query metrics we add Prometheus as a data source:
- Open Grafana's New Datasource UI
- Find and Select Prometheus
- Set the "Prometheus server URL" to
http://localhost:9090 - Click Save & Test
Grafana: Create a Dashboard
- Open the Dashboards UI.
- Create a new dashboard: New → Dashboard.
- Add a panel: Add → Visualization.
- Switch the query editor to “Code” mode using the builder/code toggle.
- Enter a PromQL query (e.g.,
rate(http_server_request_duration_seconds_count[1m])). - Save the dashboard.
We can add additional panels using more queries. Here are a few starting points:
// HTTP Request Rate (Requests/Second)
rate (http_server_request_duration_seconds_count[1m])

// HTTP Request Duration (Seconds, 95th Percentile)
histogram_quantile(
    0.95,
    sum(rate(http_server_request_duration_seconds_bucket[1m])) by (le)`

// HTTP Request Duration (Seconds, 50th Percentile)
histogram_quantile(
    0.50,
    sum(rate(http_server_request_duration_seconds_bucket[1m])) by (le))

// HTTP Request Duration (Seconds, 75th Percentile, by route)
histogram_quantile(
    0.75,
    sum(rate(http_server_request_duration_seconds_bucket[1m])) by (le, http_route))
We now know how to add metrics to our .NET Web API, collect them with Prometheus, and visualize them in Grafana. Next steps could include adding traces, correlating metrics with logs, or exporting metrics to a long-term storage backend.